README.md in trollolo-0.0.3 vs README.md in trollolo-0.0.4
- old
+ new
@@ -17,10 +17,19 @@
For expectations how the board has to be structured to make the burndown chart
functions work see the Trollolo man page. There is an
[example Trello board](https://trello.com/b/CRdddpdy/trollolo-testing-board)
which demonstrates the expected structure.
+## Installation
+
+You can install Trollolo as gem with `gem install trollolo`.
+
+For the chart generation you will need a working matplotlib installation and
+the python module to read YAML. On openSUSE you can get that with
+
+ zypper install python-matplotlib python-matplotlib-tk python-PyYAML
+
## Configuration
Trollolo reads a configuration file `.trollolorc` in the home directory of the
user running the command line tool. It reads the data required to authenticate
with the Trello server from it. It's two values (the example shows random data):
@@ -83,10 +92,20 @@
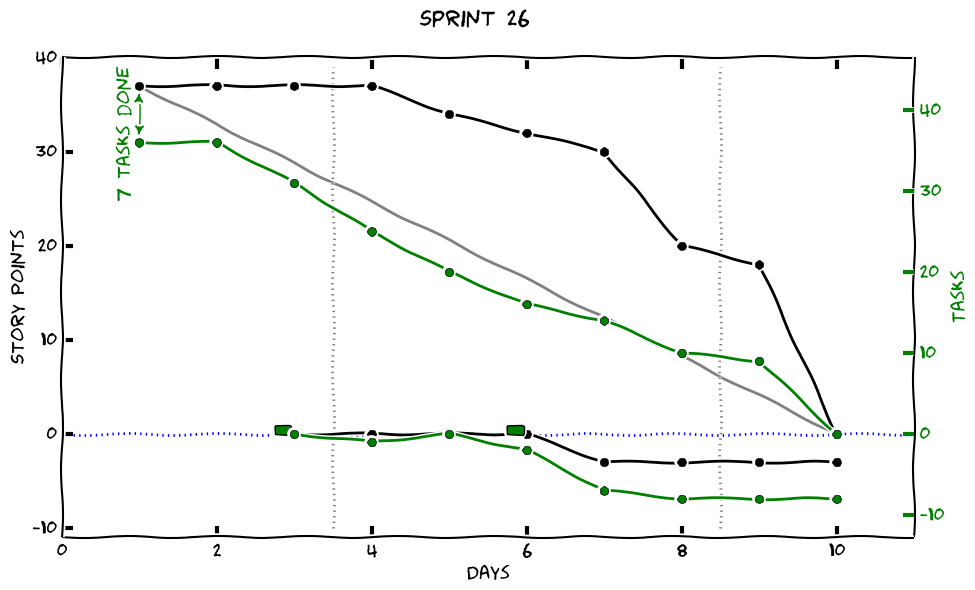
To generate the actual burndown chart, go to the working directory and call:
trollolo plot SPRINT_NUMBER
+or fetch and plot data in one step with:
+
+ trollolo burndown --plot
+
This will take the data from the file `burndown-data-SPRINT_NUMBER.yaml` and
create a nice chart from it. It will show the chart and also create a file
`burndown-SPRINT_NUMBER.png` you can upload as cover graphics to a card on your
Trello board.
+Some more info can be found in the command line help with `trollolo help` and
+`trollolo help burndown`.
+
+### Example
+
+