README.md in iruby-chartkick-0.2.1 vs README.md in iruby-chartkick-0.3.0

- old
+ new

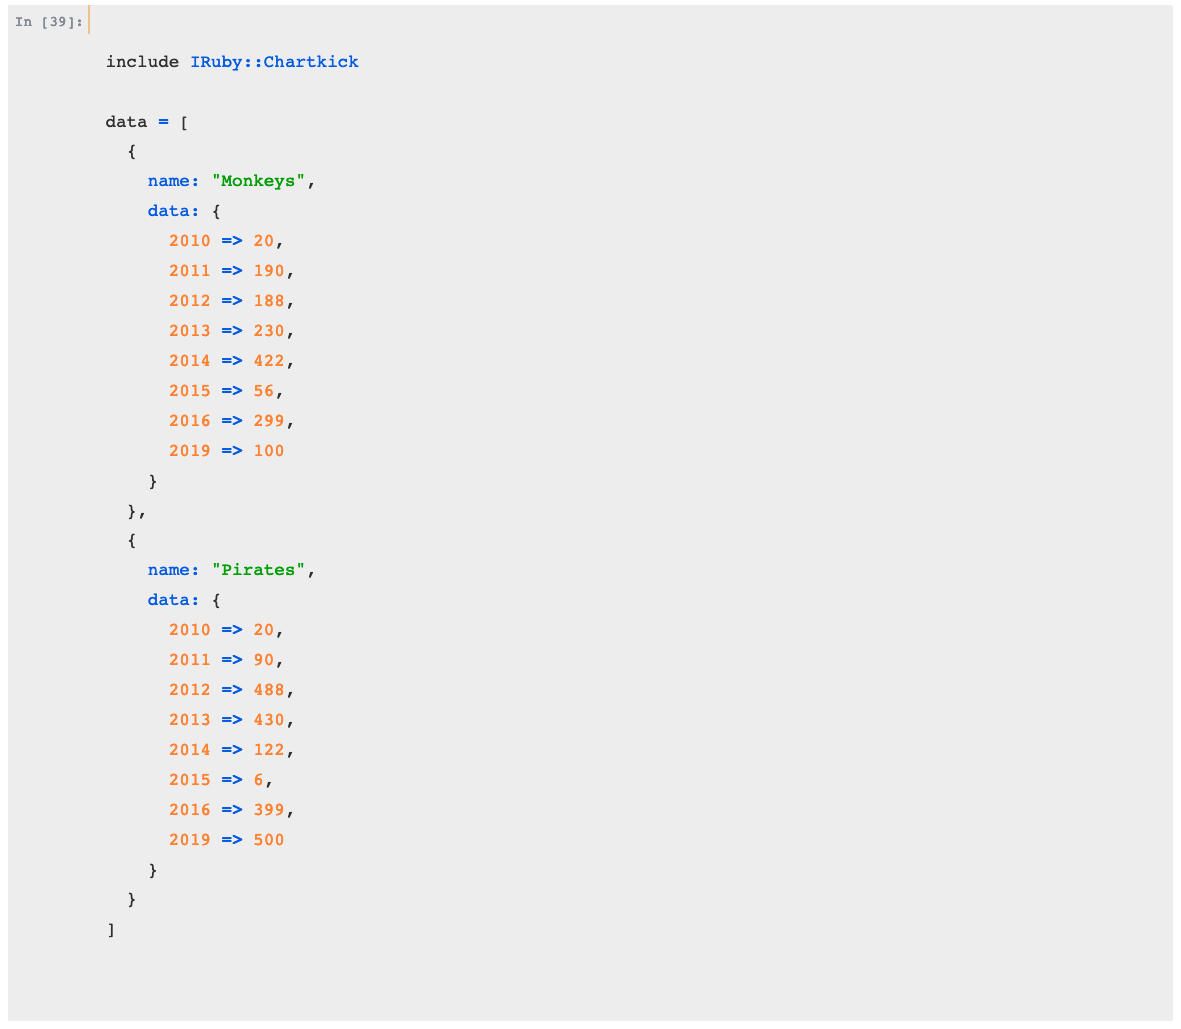
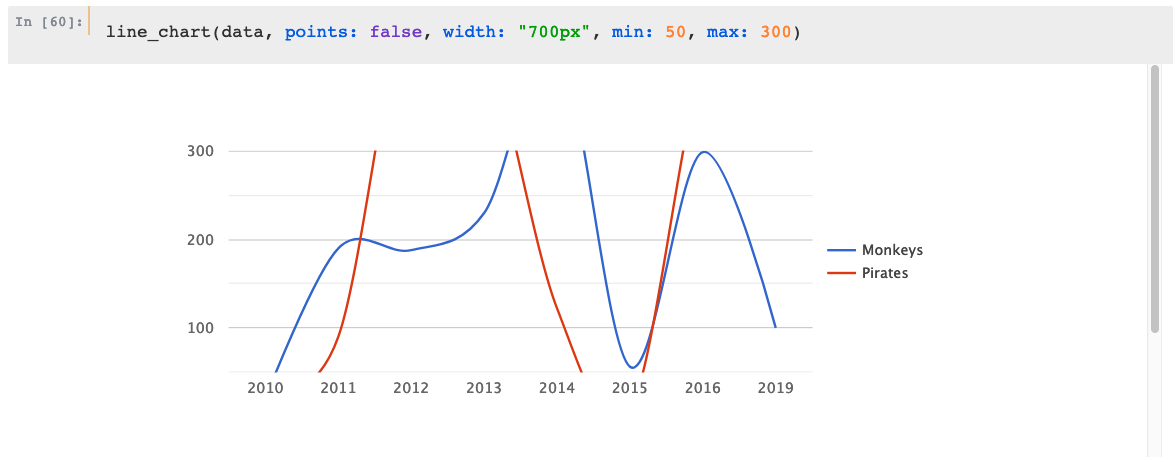
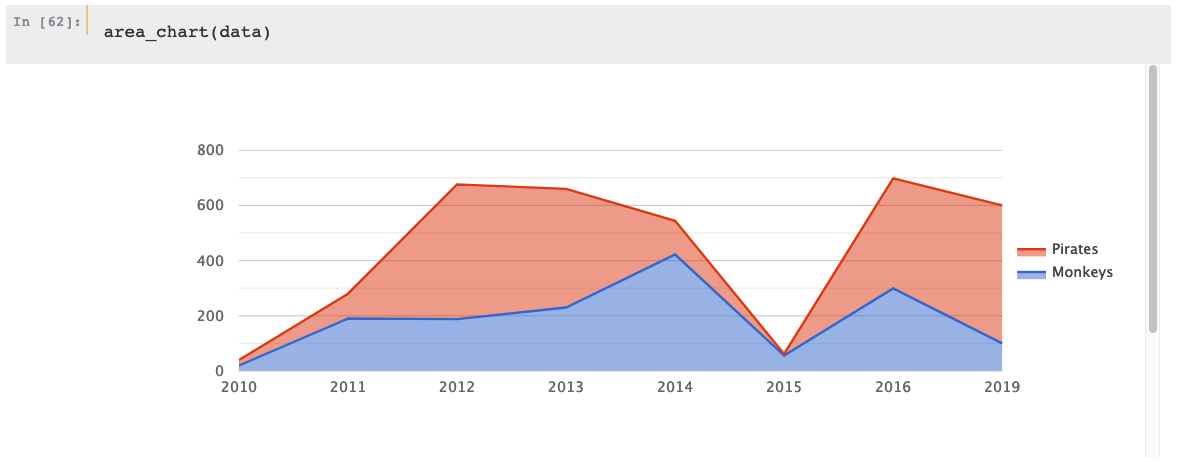
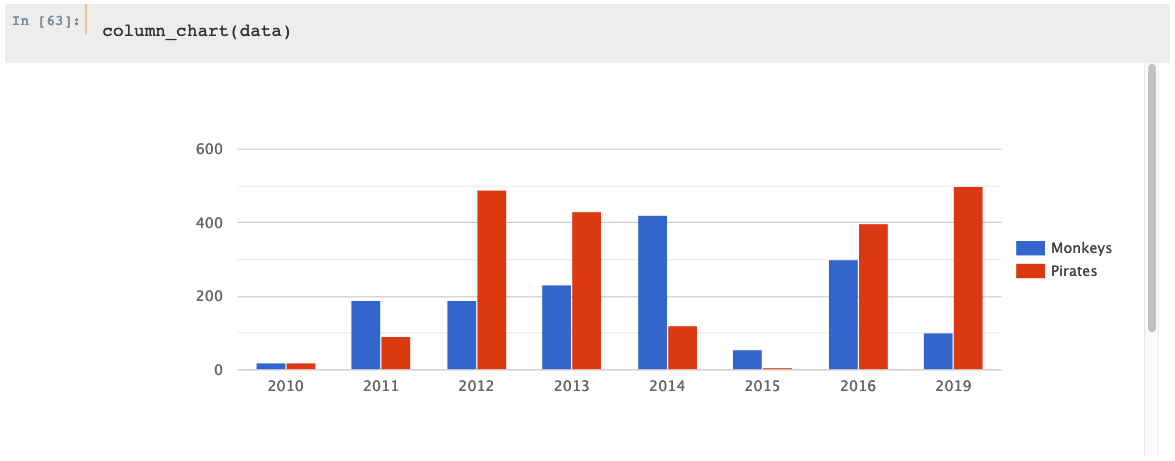
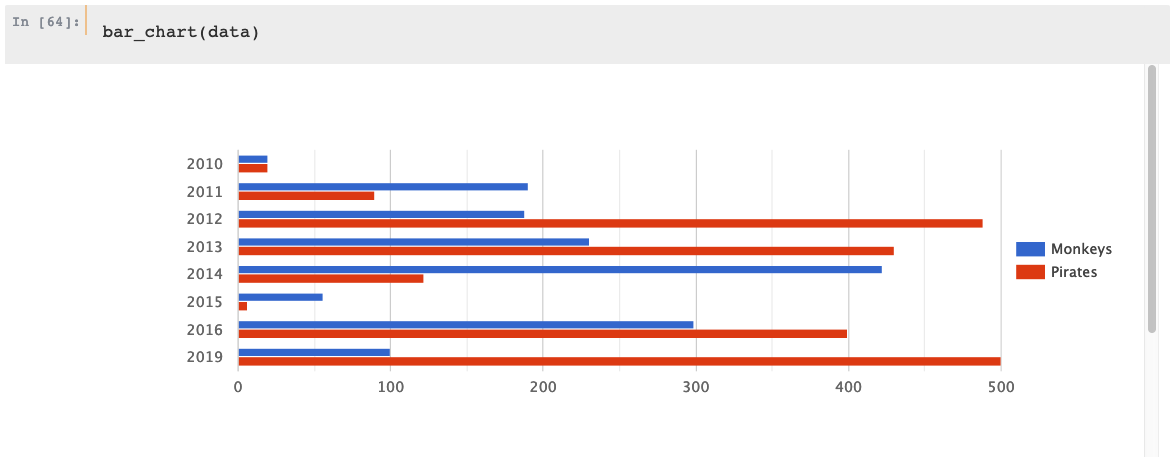
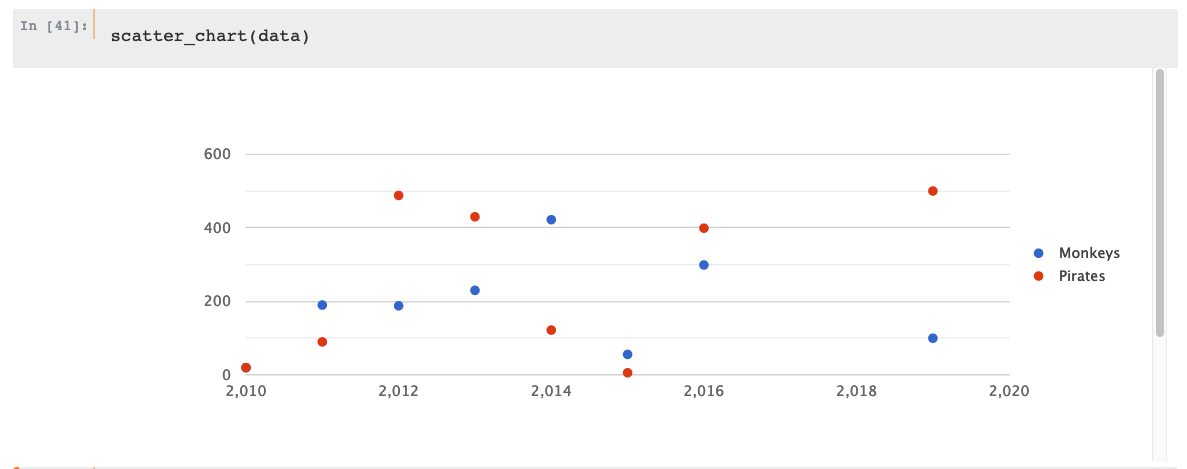
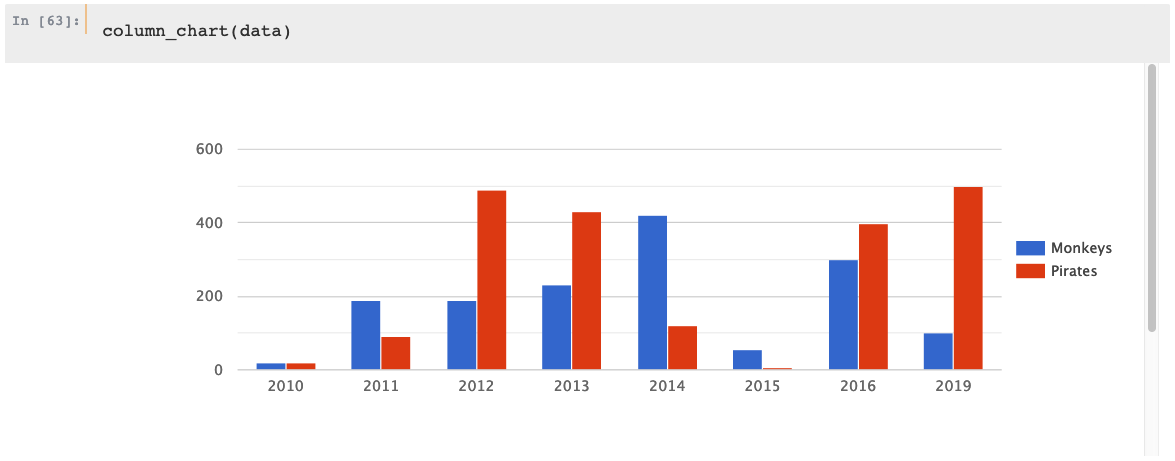
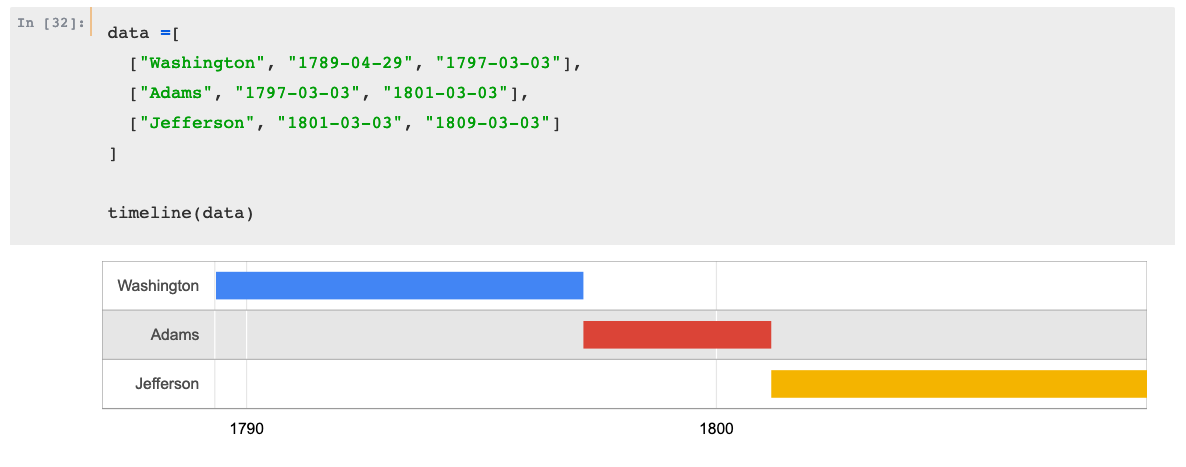
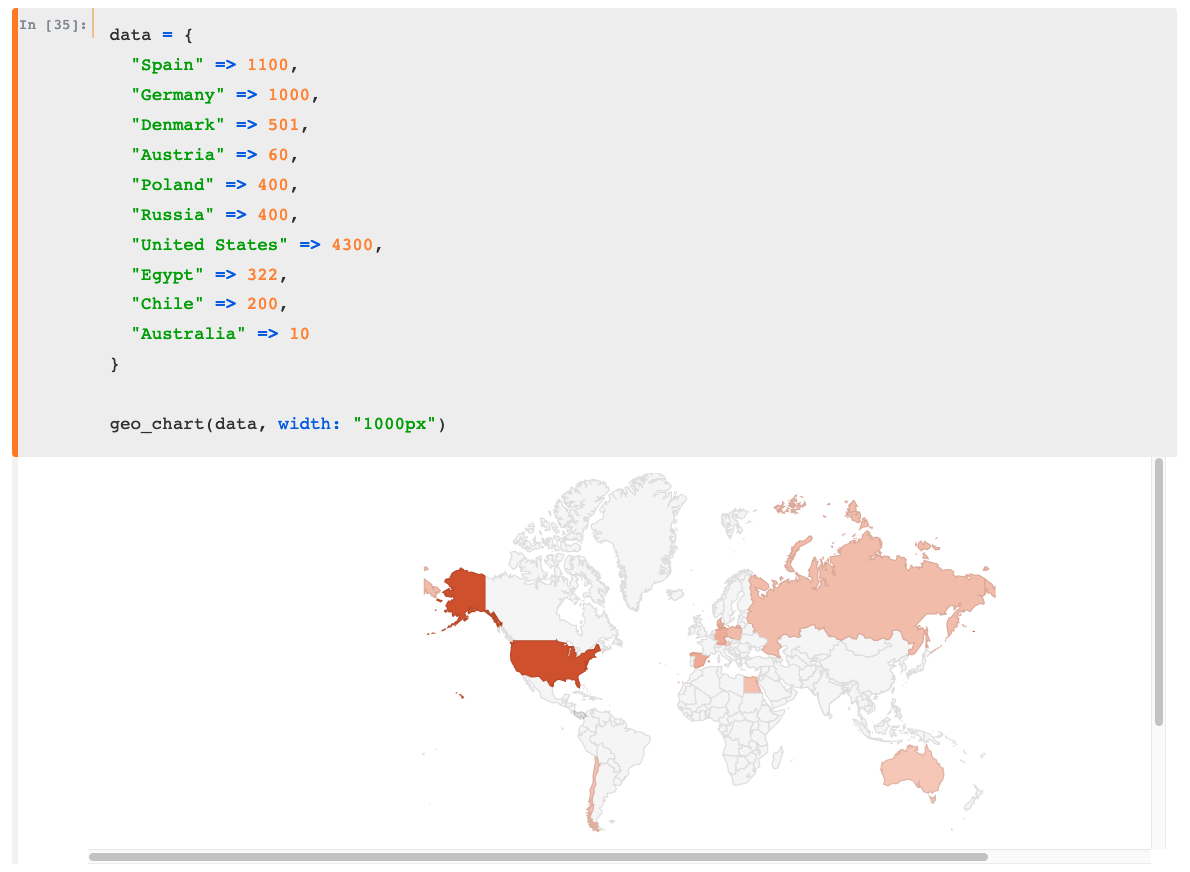
@@ -1,8 +1,8 @@ -# iruby-chartkick [![Build Status](https://travis-ci.com/Absolventa/iruby-chartkick.svg?branch=master)](https://travis-ci.com/Absolventa/iruby-chartkick) +# iruby-chartkick [![build](https://github.com/Absolventa/iruby-chartkick/actions/workflows/build.yml/badge.svg)](https://github.com/Absolventa/iruby-chartkick/actions/workflows/build.yml) -You like writing [Ruby within Juypter](https://github.com/SciRuby/iruby/) notebooks? Awesome, you're not alone - we do so, too ☀️ Since we also fell in love with the handy charting API of [ankane/chartkick](https://github.com/ankane/chartkick), we wrote this little gem bringing them together. +You like writing [Ruby within Juypter](https://github.com/SciRuby/iruby/) notebooks? Awesome, you're not alone - we do so, too ☀️ Since we also fell in love with the handy charting API of [ankane/chartkick](https://github.com/ankane/chartkick), we wrote this little gem bringing them together. `iruby-chartkick` was made for easy plug-n-play plotting data using the awesomeness of chartkick within IRuby-backed Jupyter notebooks. ### Installation @@ -10,11 +10,11 @@ ### Usage You can either include the module `IRuby::Chartkick` and use the wrapper methods, like `line_chart`: -```Ruby +```ruby include IRuby::Chartkick data = { 2019 => 1, 2020 => 122, @@ -24,11 +24,11 @@ line_chart(data) ``` Or you use the chart wrapper classes directly: -```Ruby +```ruby include IRuby::Chartkick data = { 2019 => 1, 2020 => 122, @@ -38,16 +38,99 @@ IRuby::Chartkick::LineChart.new(data).plot ``` ### Examples: +```ruby +include IRuby::Chartkick -![Bildschirmfoto 2019-11-04 um 16 57 36](https://user-images.githubusercontent.com/3685123/68135598-3be0bb00-ff24-11e9-9d09-237c8aeb15d8.png) -![Bildschirmfoto 2019-11-04 um 16 54 38](https://user-images.githubusercontent.com/3685123/68135613-426f3280-ff24-11e9-96a0-0e3cfe834524.png) -![Bildschirmfoto 2019-11-04 um 16 55 35](https://user-images.githubusercontent.com/3685123/68135621-456a2300-ff24-11e9-8de9-a95d6b5d67c6.png) -![Bildschirmfoto 2019-11-04 um 16 56 04](https://user-images.githubusercontent.com/3685123/68135631-47cc7d00-ff24-11e9-982a-90885b8ddf94.png) -![Bildschirmfoto 2019-11-04 um 16 56 17](https://user-images.githubusercontent.com/3685123/68135638-48fdaa00-ff24-11e9-9a51-36494509c3b7.png) -![Bildschirmfoto 2019-11-04 um 16 56 31](https://user-images.githubusercontent.com/3685123/68135648-4bf89a80-ff24-11e9-8ba0-fae17d670995.png) -![Bildschirmfoto 2019-11-04 um 16 47 49](https://user-images.githubusercontent.com/3685123/68135661-5024b800-ff24-11e9-96ad-9c4deba61c57.png) -![Bildschirmfoto 2019-11-04 um 16 56 17](https://user-images.githubusercontent.com/3685123/68135689-59158980-ff24-11e9-8fab-8ab529dfaeb4.png) -![Bildschirmfoto 2019-11-04 um 16 43 15](https://user-images.githubusercontent.com/3685123/68135699-5d41a700-ff24-11e9-9267-ee37516620c8.png) -![Bildschirmfoto 2019-11-04 um 16 46 17](https://user-images.githubusercontent.com/3685123/68135704-5f0b6a80-ff24-11e9-8165-e682ea70975d.png) +data = [ + { + name: "Monkeys", + data: { + 2010 => 20, + 2011 => 190, + 2012 => 188, + 2013 => 230, + 2014 => 422, + 2015 => 56, + 2016 => 299, + 2019 => 100 + } + }, + { + name: "Pirates", + data: { + 2010 => 20, + 2011 => 90, + 2012 => 488, + 2013 => 430, + 2014 => 122, + 2015 => 6, + 2016 => 399, + 2019 => 500 + } + } +] +``` + +#### LineChart + +```ruby +line_chart(data) +``` +![LineChart](https://user-images.githubusercontent.com/3856862/136750966-3fe8908d-356c-477e-8c0e-220bc302d07e.png) + +```ruby +line_chart(data, points: false) +``` +![LineChart](https://user-images.githubusercontent.com/3856862/136767403-a2839f21-d6af-45af-a710-2f9f0ed2203c.png) + +```ruby +line_chart(data, points: false, width: "700px", min: 50, max: 300) +``` +![LineChart](https://user-images.githubusercontent.com/3856862/136751184-7d96c152-ec1f-490a-9676-0ea16606addf.png) + +#### AreaChart + +```ruby +area_chart(data) +``` +![AreaChart](https://user-images.githubusercontent.com/3856862/136751437-9ceb092c-b1a1-4aee-a868-91a0ac3e9cbc.png) + +#### ColumnChart + +```ruby +column_chart(data) +``` +![ColumnChart](https://user-images.githubusercontent.com/3856862/136751574-252b40cb-b842-41ff-8a25-57695eb4e5b0.png) + +#### BarChart + +```ruby +bar_chart(data) +``` +![BarChart](https://user-images.githubusercontent.com/3856862/136751822-8383166d-894b-42fd-8ea7-fecf00964567.png) + +#### ScatterChart + +```ruby +scatter_chart(data) +``` +![ScatterChart](https://user-images.githubusercontent.com/3856862/136751938-35acbdc7-baee-4262-ac67-1fe1262f071c.png) + +#### PieChart + +```ruby +include IRuby::Chartkick + +data = [ + ["Blueberry", 44], + ["Strawberry", 23], + ["Banana", 22], + ["Apple", 21], + ["Grape", 13] +] + +pie_chart(data) +``` +![PieChart](https://user-images.githubusercontent.com/3856862/136752074-d5bc9ecb-b046-4b84-9108-546326125db4.png)