sample-dashboard/README.md in influxdb-rails-1.0.1.beta3 vs sample-dashboard/README.md in influxdb-rails-1.0.1
- old
+ new
@@ -2,40 +2,46 @@
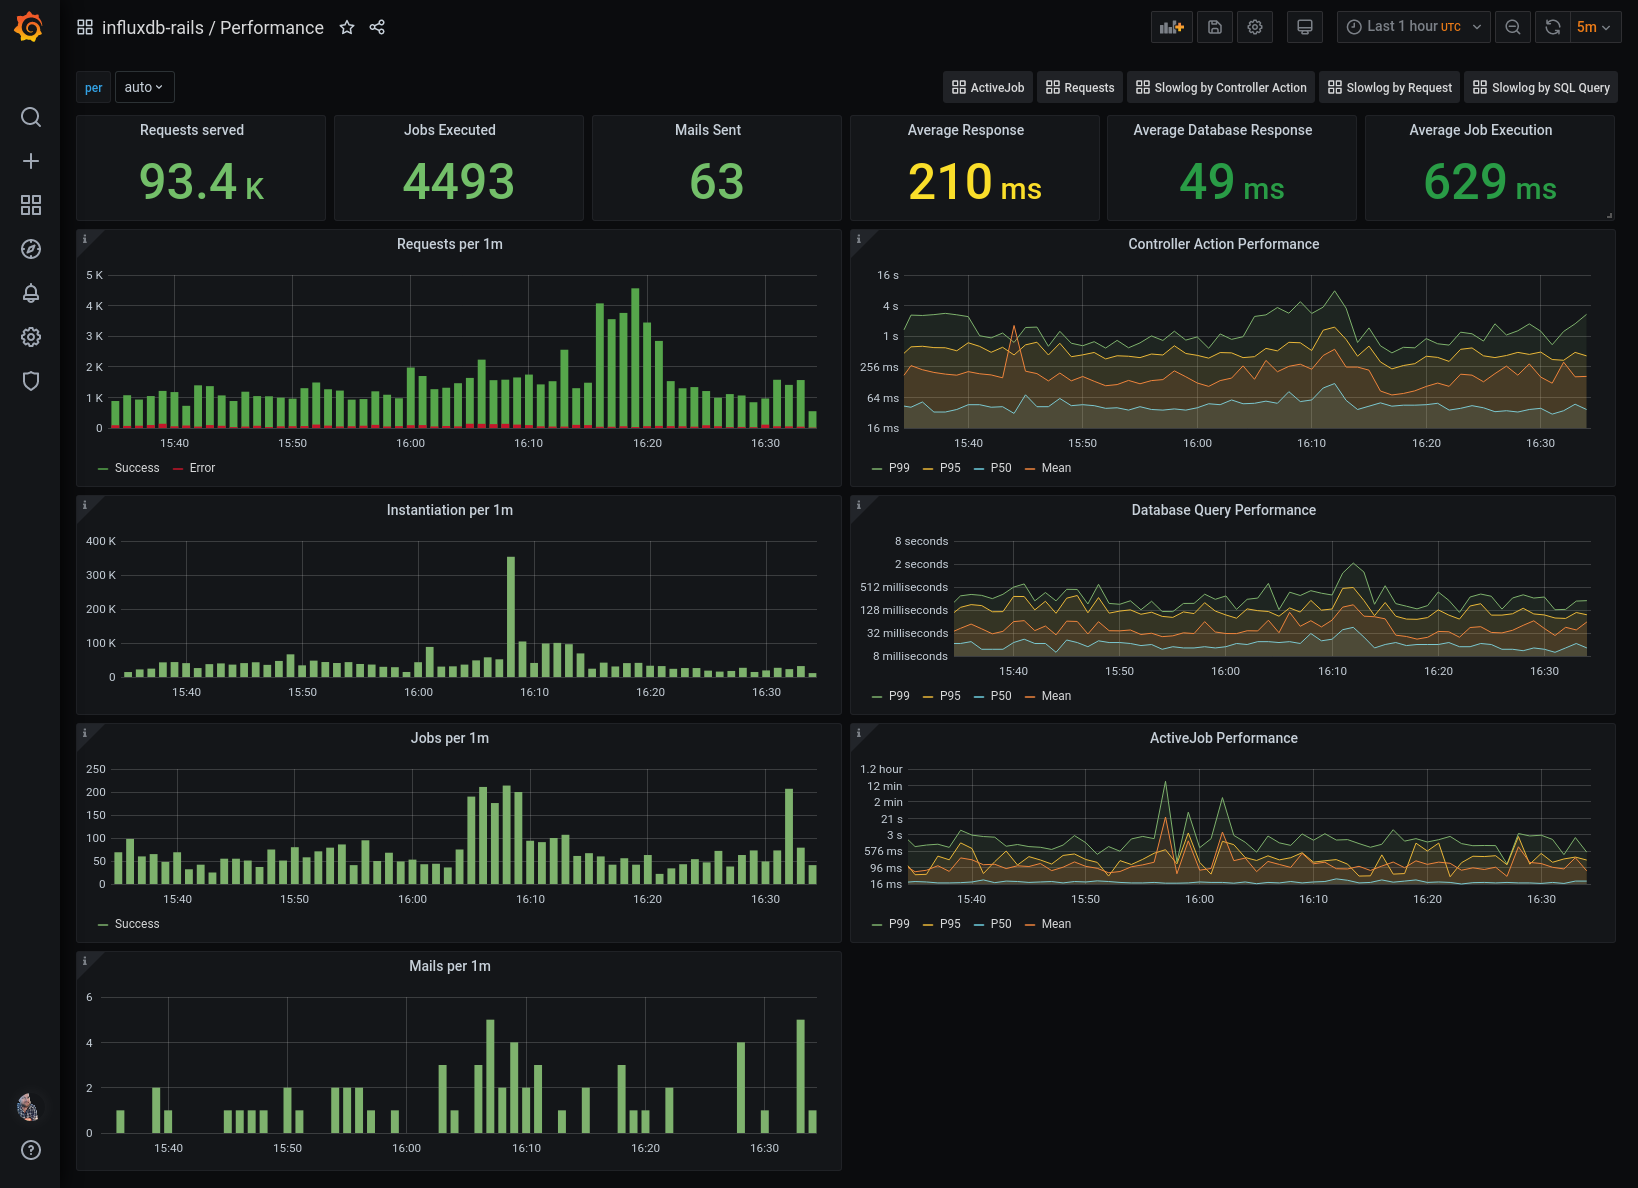
A dashboard providing Ruby on Rails performance insights based on
[Free Software](https://www.fsf.org/about/what-is-free-software), ready to
run inside your data-center.
-
+
-By default it measures (in various forms):
+By default it measures (in various forms) performance of:
-- Controller Action Runtime
-- View/Partial Render Runtime
-- Database Query Runtime
+- Controller Actions
+- View/Partial Rendering
+- Database Queries
+- ActiveJobs
+- ActionMailers
-It provides an overview and you can also drill down into numbers on a per request basis. Of course you can use all the awesome features that Influx (Downsampling/Data Retention), Grafana (Alerts, Annotations) and influxdb-rails (custom tags) provide and extend this to your needs. Use your freedom and run, copy, distribute, study, change and improve this software!
+The dashboards provide an overview and various ways to drill down into numbers on a per request or per action basis. Of course you can use all the awesome features that Influx (Downsampling/Data Retention), Grafana (Alerts, Annotations) and influxdb-rails (custom tags) provide and extend this to your needs. Use your freedom and run, copy, distribute, study, change and improve this software!
## Requirements
-To be able to measure performance you need the following things available:
+To be able to measure performance of your Ruby on Rails application you need to have the following things available:
-- [InfluxDB 1.x](https://docs.influxdata.com/influxdb/v1.8/introduction/install/)
-- [Grafana](https://grafana.com/docs/)
+- [InfluxDB 1.x](https://www.influxdata.com/products/influxdb/)
+- [Grafana](https://grafana.com/)
- A [Ruby On Rails](https://rubyonrails.org/) application with [influxdb-rails](https://github.com/influxdata/influxdb-rails) enabled
## Installation
-Once you have influx/grafana instances running in your infrastructure just [import both
-dashboards from grafana](https://grafana.com/docs/reference/export_import/#importing-a-dashboard).
+Once you have influx/grafana instances running in your infrastructure just [import the
+dashboards from grafana.com](https://grafana.com/docs/reference/export_import/#importing-a-dashboard).
-- [Overview Dashboard](https://grafana.com/dashboards/10428)
-- [Request Dashboard](https://grafana.com/dashboards/10429)
+- [Ruby On Rails Performance Overview](https://grafana.com/dashboards/10428/)
+- Performance insights into individual requests, see [Ruby On Rails Performance per Request](https://grafana.com/dashboards/10429/)
+- Performance of individual actions, see [Ruby On Rails Performance per Action](https://grafana.com/grafana/dashboards/11031)
+- [Ruby On Rails Health Overview](https://grafana.com/grafana/dashboards/14115)
+- [Ruby on Rails ActiveJob Overview](https://grafana.com/grafana/dashboards/14116)
+- [Ruby on Rails Slowlog by Request](https://grafana.com/grafana/dashboards/14118)
+- [Ruby on Rails Slowlog by Action](https://grafana.com/grafana/dashboards/14117)
+- [Ruby on Rails Slowlog by SQL](https://grafana.com/grafana/dashboards/14119)
You can also paste the `.json` files from this repository.
-In the unlikely case that you need to change the dashboard *UID*s during import you can configure the *UID* the `Overview` dashboard uses to link to the `Request` dashboard in the [variables](https://grafana.com/docs/reference/templating/#adding-a-variable). Just paste whatever *UID* you've set up for the `Request` dashboard.
-
## Demo
This repository includes a [docker-compose](https://docs.docker.com/compose/) demo setup that brings a simple rails app, influxdb and grafana.
### Starting the demo services
@@ -51,22 +57,9 @@
Go to http://0.0.0.0:4000 and do some things. Every request to the rails app will generate performance data in the demo.
### ...or Configure your own Rails app...
You can also use the dashboard with any other rails app you already have. Follow our [install instructions](https://github.com/influxdata/influxdb-rails/#installation), the default configuration works with the demo InfluxDB running on localhost:8086.
-
-To be able to view individual requests you have to enable request ID tags in your application. Something like:
-
-```ruby
-class ApplicationController < ActionController::Base
-
- before_action :set_influx_data
-
- def set_influx_data
- InfluxDB::Rails.current.values = { request: request.request_id }
- end
-end
-```
### ...then see the dashboards in action
Just go to http://0.0.0.0:3000 and log in with admin/admin.