# TraceTree
Print TracePoint(`:b_call`, `:b_return`, `:c_call`, `:c_return`, `:call`, `:return`, `:class`, `:end`, `:thread_begin`, `:thread_end`) in tree view, to console or html.
*Notice: it does not trace `:raise`, which can be represented by Kernel#raise(`:c_call`)*
- [Installation](#installation)
- [Usage](#usage)
- [Parameters](#parameters)
- [Example 1: Output to HTML](#example-1-output-to-html)
- [Example 2: Output to STDOUT](#example-2-output-to-stdout)
## Installation
Add this line to your application's Gemfile:
```ruby
gem 'trace_tree'
```
And then execute:
$ bundle
Or install it yourself as:
$ gem install trace_tree
## Usage
Just call the method you want to trace in the block passed to `binding.trace_tree`:
```ruby
things_done = binding.trace_tree do
somebody.do_something
end
```
### Parameters
You may pass optional parameters while invoking `binding.trace_tree`, for example:
```ruby
binding.trace_tree(file, color: false, gem: false) do
somebody.do_something
end
```
* `file == STDOUT` by default. You can give it a File object or anything responds to `puts`.
* `:color => true` by default. It makes method names have different color than source_location in output. When you print the output to file, you may want to set it false to discard those color ANSI escape sequences.
* `:gem => true` by default. Replace the gem paths in source_location with $GemPathN, which shorten lines. To see what are replaced, inspect `TraceTree::GemPaths`.
* `:html => nil` by default. Set it true to generate a html in which a tree constructed with `<ul>`, `<li>`. (No need to set `color`).
* `:tmp => nil` by default. Set it true or a string or an array of string to specify a tmp file under the default tmp dir of your system. (No need to provide `file` argument. It makes parent directories as needed). The tmp dir location can be found with `TraceTree.tmp`.
* `:htmp => nil` by default. It is combination of `:html` and `:tmp`.
* `:return => true` by default. It stores return values of functions in generated html. Hover function call and press `r` to print return value in console.
* `:args => false` by default. Set it true to puts arguments of `:call` functions into html. Since arguments are always return values of other functions, so this option is not necessary.
* `:in => //, :out => nil` by default. Give them regexp(s) to include/exclude methods defined in files match that regexp(s). Notice thread-calls and methods defined by `define_method` are always included. Also, once you set any of these two options, the code to trace should not be in same line with `binding.trace_tree() do`.
* `:no_methods => nil` by default. Give it regexp(s) to hide stack under matching methods. Useful when you want to dump stack of a rack middleware but lower middlewares.
* `:warm => nil` by default. Set it something unique to the code block so that the code block will be traced only when it's called second time, in case we dump lots of code loading and initialization.
* `:timer => nil` by default. Set it true if you want to know how much time spent in tracing and drawing tree. Notice the `file` should be appendable, otherwise the time will overwrite the tree.
* `:debug => nil` by default. Give it somthing like what for `:tmp` to output a whole list of TracePoints in file for debug.
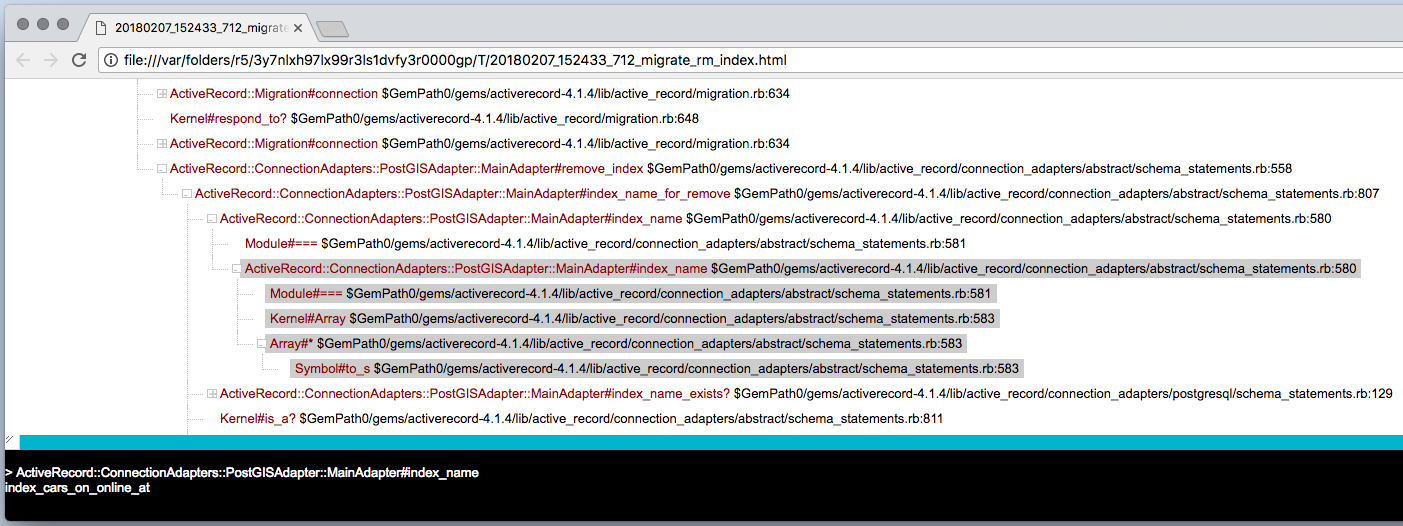
### Example 1: Output to HTML
Try to remove a non-existing index:
```ruby
[4] pry(main)> binding.trace_tree(htmp: 'migrate_rm_index'){ ActiveRecord::Migration.new.remove_index "cars", [:online_at] }
-- remove_index("cars", [:online_at])
ArgumentError: Index name 'index_cars_on_online_at' on table 'cars' does not exist
```
Then find the result HTML in tmp dir. Move your mouse on any method name, and press `f`/`u` to fold/unfold it's callee, press `p`/`n` to jump to it's previous/next sibling call, press `r` to print return value in console.
You may type `group_by_file()` in console, to group callees defined in same file, under additional `li` tag. Type `group_by_file()` once again to switch back.
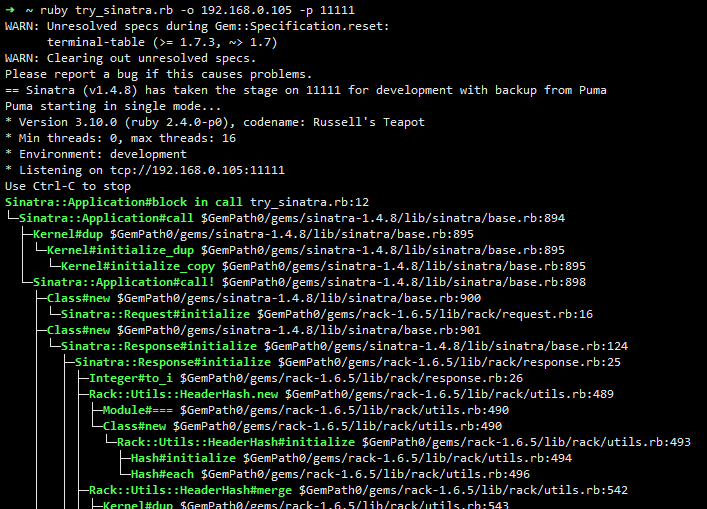
### Example 2: Output to STDOUT
Want to know what `Sinatra::Base#call` does? Wrap it with `binding.trace_tree`:
```ruby
require 'sinatra'
require 'trace_tree'
get '/' do
'welcome'
end
class Sinatra::Base
alias_method :o_call, :call
def call env
binding.trace_tree do
o_call env
end
end
end
```
Execute that sinatra script as normal, then you will see in console: